Program Events
Schedule, configure, and manage one-time control events for a battery program
How to schedule, configure, and manage one-time control events for a battery program. For reading the results of an event, see the companion guide, Program Event Reports.
Program event overview#
A program event is a one-time control event scheduled for a specific date and time. It sends one or more commands — called actions — to the devices enrolled in a program, asking them to charge, hold, or discharge during set windows (for example, charging batteries during the day and discharging them to the grid during an evening peak).
Every event moves through a lifecycle, shown as a status on the events list:
| Status | What it means |
|---|---|
| Draft | Created but not yet scheduled — still being configured. Drafts are hidden from the list by default. |
| Scheduled | Configured and queued to run at its scheduled date and time. |
| In Progress | Currently running — the event window is active and commands are being sent. |
| Completed | Finished. The event's performance can now be viewed in Reports. |
How an event was triggered#
Alongside its status, each event carries a type badge showing how it was triggered:
| Type | What it means |
|---|---|
| Signal | The event was triggered by a third-party integration — such as Leap — that sends Texture an event notification to schedule and react to. These are dispatched by the partner rather than created by hand. |
| Manually | The event was created and scheduled directly in Texture using Schedule Event (see below). |
You'll find events under Programs → Program Events.
The Program Events list#
Open a program from the dashboard, then select Program Events in the left navigation (alongside Overview, Enrollments, Monitoring, Reports, and Configuration). The page is titled "Schedule one-time control events for specific dates and times."
Filtering the list#
Use the program selector at the top right to choose which program you're viewing. A row of filter chips narrows the list:
- In Progress, Scheduled, Completed — filter by event status. These are shown by default.
- Drafts — off by default; turn it on to see events that haven't been scheduled yet.
- Date range — limit the list to a span of dates, useful for programs with long event histories.
Reading the list#
Each row shows:
| Column | What it shows |
|---|---|
| Event | The event date and the number of actions it contains (e.g., "3 actions"). |
| Status | A status badge (Completed, Scheduled, etc.) and a type badge showing how it was triggered (e.g., Signal). |
| Scheduled Time | The event's overall time window (e.g., 9:00 PM – 11:00 PM), in your local time. |
| ⋯ menu | Per-event actions such as editing or deleting the event. |
Creating and scheduling an event#
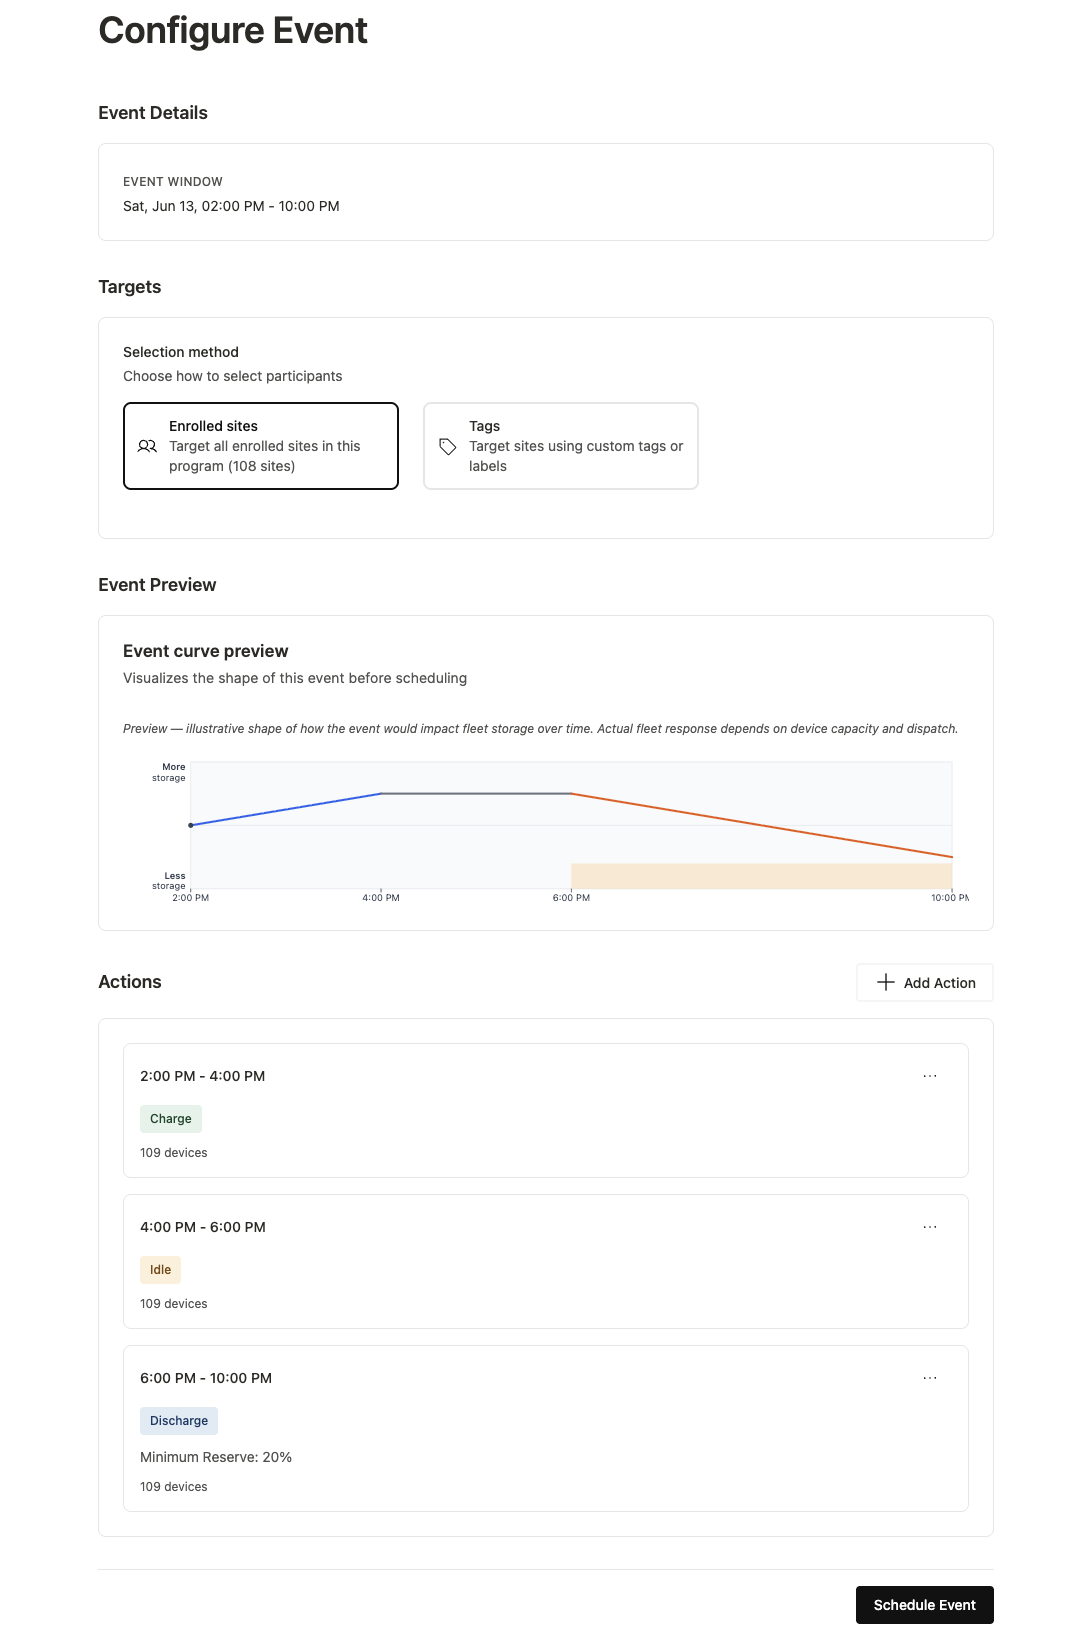
From the Program Events page, click Schedule Event (top right). Confirm the correct program is selected first. This opens the Configure Event page, which has four sections.
- Event Details — the event's timing is derived from its actions. Before any action exists it prompts "Add an action below to set the event timing"; once actions are added it shows the overall Event Window (date and combined time span, e.g., Sat, Jun 13, 02:00 PM – 10:00 PM).
- Targets — choose how participants are selected (see Targets below).
- Add at least one Action — define what devices should do and when (see Configuring actions).
- Review the Event Preview — the Event curve preview visualizes the shape of the event before you schedule it (see Reading the Event curve preview).
- Click Schedule Event — this button is enabled once at least one action exists. Use Delete to discard the event instead.
Targets: choosing participants#
Under Selection method, pick how the event targets devices:
| Selection method | Who it targets |
|---|---|
| Enrolled sites | All sites currently enrolled in the program. The option shows the live count (e.g., "108 sites"). |
| Tags | Only sites that carry specific custom tags or labels — useful for running an event against a subset of the fleet. |
Reading the Event curve preview#
As you add actions, the Event curve preview draws the expected shape of the event across its window. The vertical axis runs from Less storage to More storage (the fleet's state of charge), and the horizontal axis is the event's time window. Each action type draws a distinct segment:
- Charge — the line slopes up (shown blue): the fleet is storing energy.
- Idle — the line is flat (grey): storage is held steady.
- Discharge — the line slopes down (orange) and the discharge window is shaded: the fleet is delivering energy to the grid.
The curve is a planning aid, not a forecast. The preview shows an illustrative shape of how the event would move fleet storage over time. Actual fleet response depends on each device's capacity and how the dispatch plays out — so treat it as a sanity check on the event's shape, not a prediction of energy delivered.
Configuring actions#
Actions are the building blocks of an event. Click Add Action to open the action drawer and define each phase. An event can contain several actions in sequence.
This section is battery-specific. The action settings described below — Operating Mode (Charge / Discharge / Idle / Reset to Default), Minimum Reserve, and the charge/discharge/idle curve — apply to battery programs. Programs targeting other asset types (EV chargers, thermostats) present different control options in the Add Action drawer.
Schedule#
- Date (required) — the calendar date the action runs.
- Start Time / End Time (both required) — the action's window, entered in your local time.
Battery control#
Set the Operating Mode — what the battery should do during the window:
| Operating Mode | What the battery does |
|---|---|
| Charge | Draws energy in to charge the battery (typically pre-charging ahead of a discharge window). |
| Discharge | Sends energy out to the grid during the window. |
| Idle | Holds — neither charging nor discharging. |
| Reset to Default | Returns the battery to its normal, pre-event operating behavior. |
When the mode is Discharge, you can set a Minimum Reserve — the battery state-of-charge floor the discharge will not go below (e.g., 20%), preserving the customer's backup capacity.
Reviewing the action list#
Each action you add appears as a card showing its time window, its mode badge (Charge, Idle, or Discharge), and the number of devices it targets (e.g., "109 devices"). Discharge cards also display the Minimum Reserve. A ⋯ menu on each card lets you edit or remove it.
Sequencing multiple actions#
Add as many actions as the event needs; they display in chronological order. A typical battery DR event chains a charge-up into an evening discharge. For example:
| Phase | Window | Devices | Notes |
|---|---|---|---|
| Charge | 2:00 PM – 4:00 PM | 109 | — |
| Idle | 4:00 PM – 6:00 PM | 109 | — |
| Discharge | 6:00 PM – 10:00 PM | 109 | Minimum Reserve 20% |
The combined windows define the event's overall Event Window, and the Event curve preview updates as you add or edit actions.
The Event Details page#
Click any event in the list to open its detail view. The breadcrumb shows Program → Program Events → Event Details, with the event's date, time window, and its status and type badges. A View report button (top right) jumps to the full performance report.
Actions#
The Actions panel lists each phase in chronological order, with its window and a per-action status (e.g., Completed). Discharge actions also show their minimum reserve.
Participation summary#
- Enrolled Sites — the number of sites included in the event.
- Overall Response Rate — the share of sites/devices that acknowledged the dispatch.
Site table#
| Column | What it shows |
|---|---|
| Site | The participating site address. |
| Device | The device at that site (manufacturer and model). |
| Response | A bar and percentage showing how fully the device responded (0% = no response, 100% = full). |
| Grid Energy | Net energy exchanged with the grid: ↑ exported to grid, ↓ imported from grid. A dash (—) means no net grid energy was attributed for this window — for example, the device didn't report, had no measurable net flow, or its charge and discharge netted out. |
After the event: reporting#
Once an event is Completed, click View report from the Event Details page (or the events list). This opens the program's Reports tabs filtered to the event's date, where you can review energy delivered, device participation, and fleet health.
For full definitions of every reporting metric and how to read the charts, see the companion guide, Program Event Reports.
Recent reporting changes that affect events#
- Device participation is now scoped to command-eligible device types (batteries and similar). Historical batches that included ineligible device types are flagged with an "Ineligible – wrong device type" badge.
- Event actions now sort chronologically on the detail view.
- The energy KPI formerly labeled "Energy Delivered" is now "Net Grid Energy," and a separate battery discharge energy tile was added.