Alerts
Operational signals from devices, sites, and integrations — captured, classified, configured, and actionable
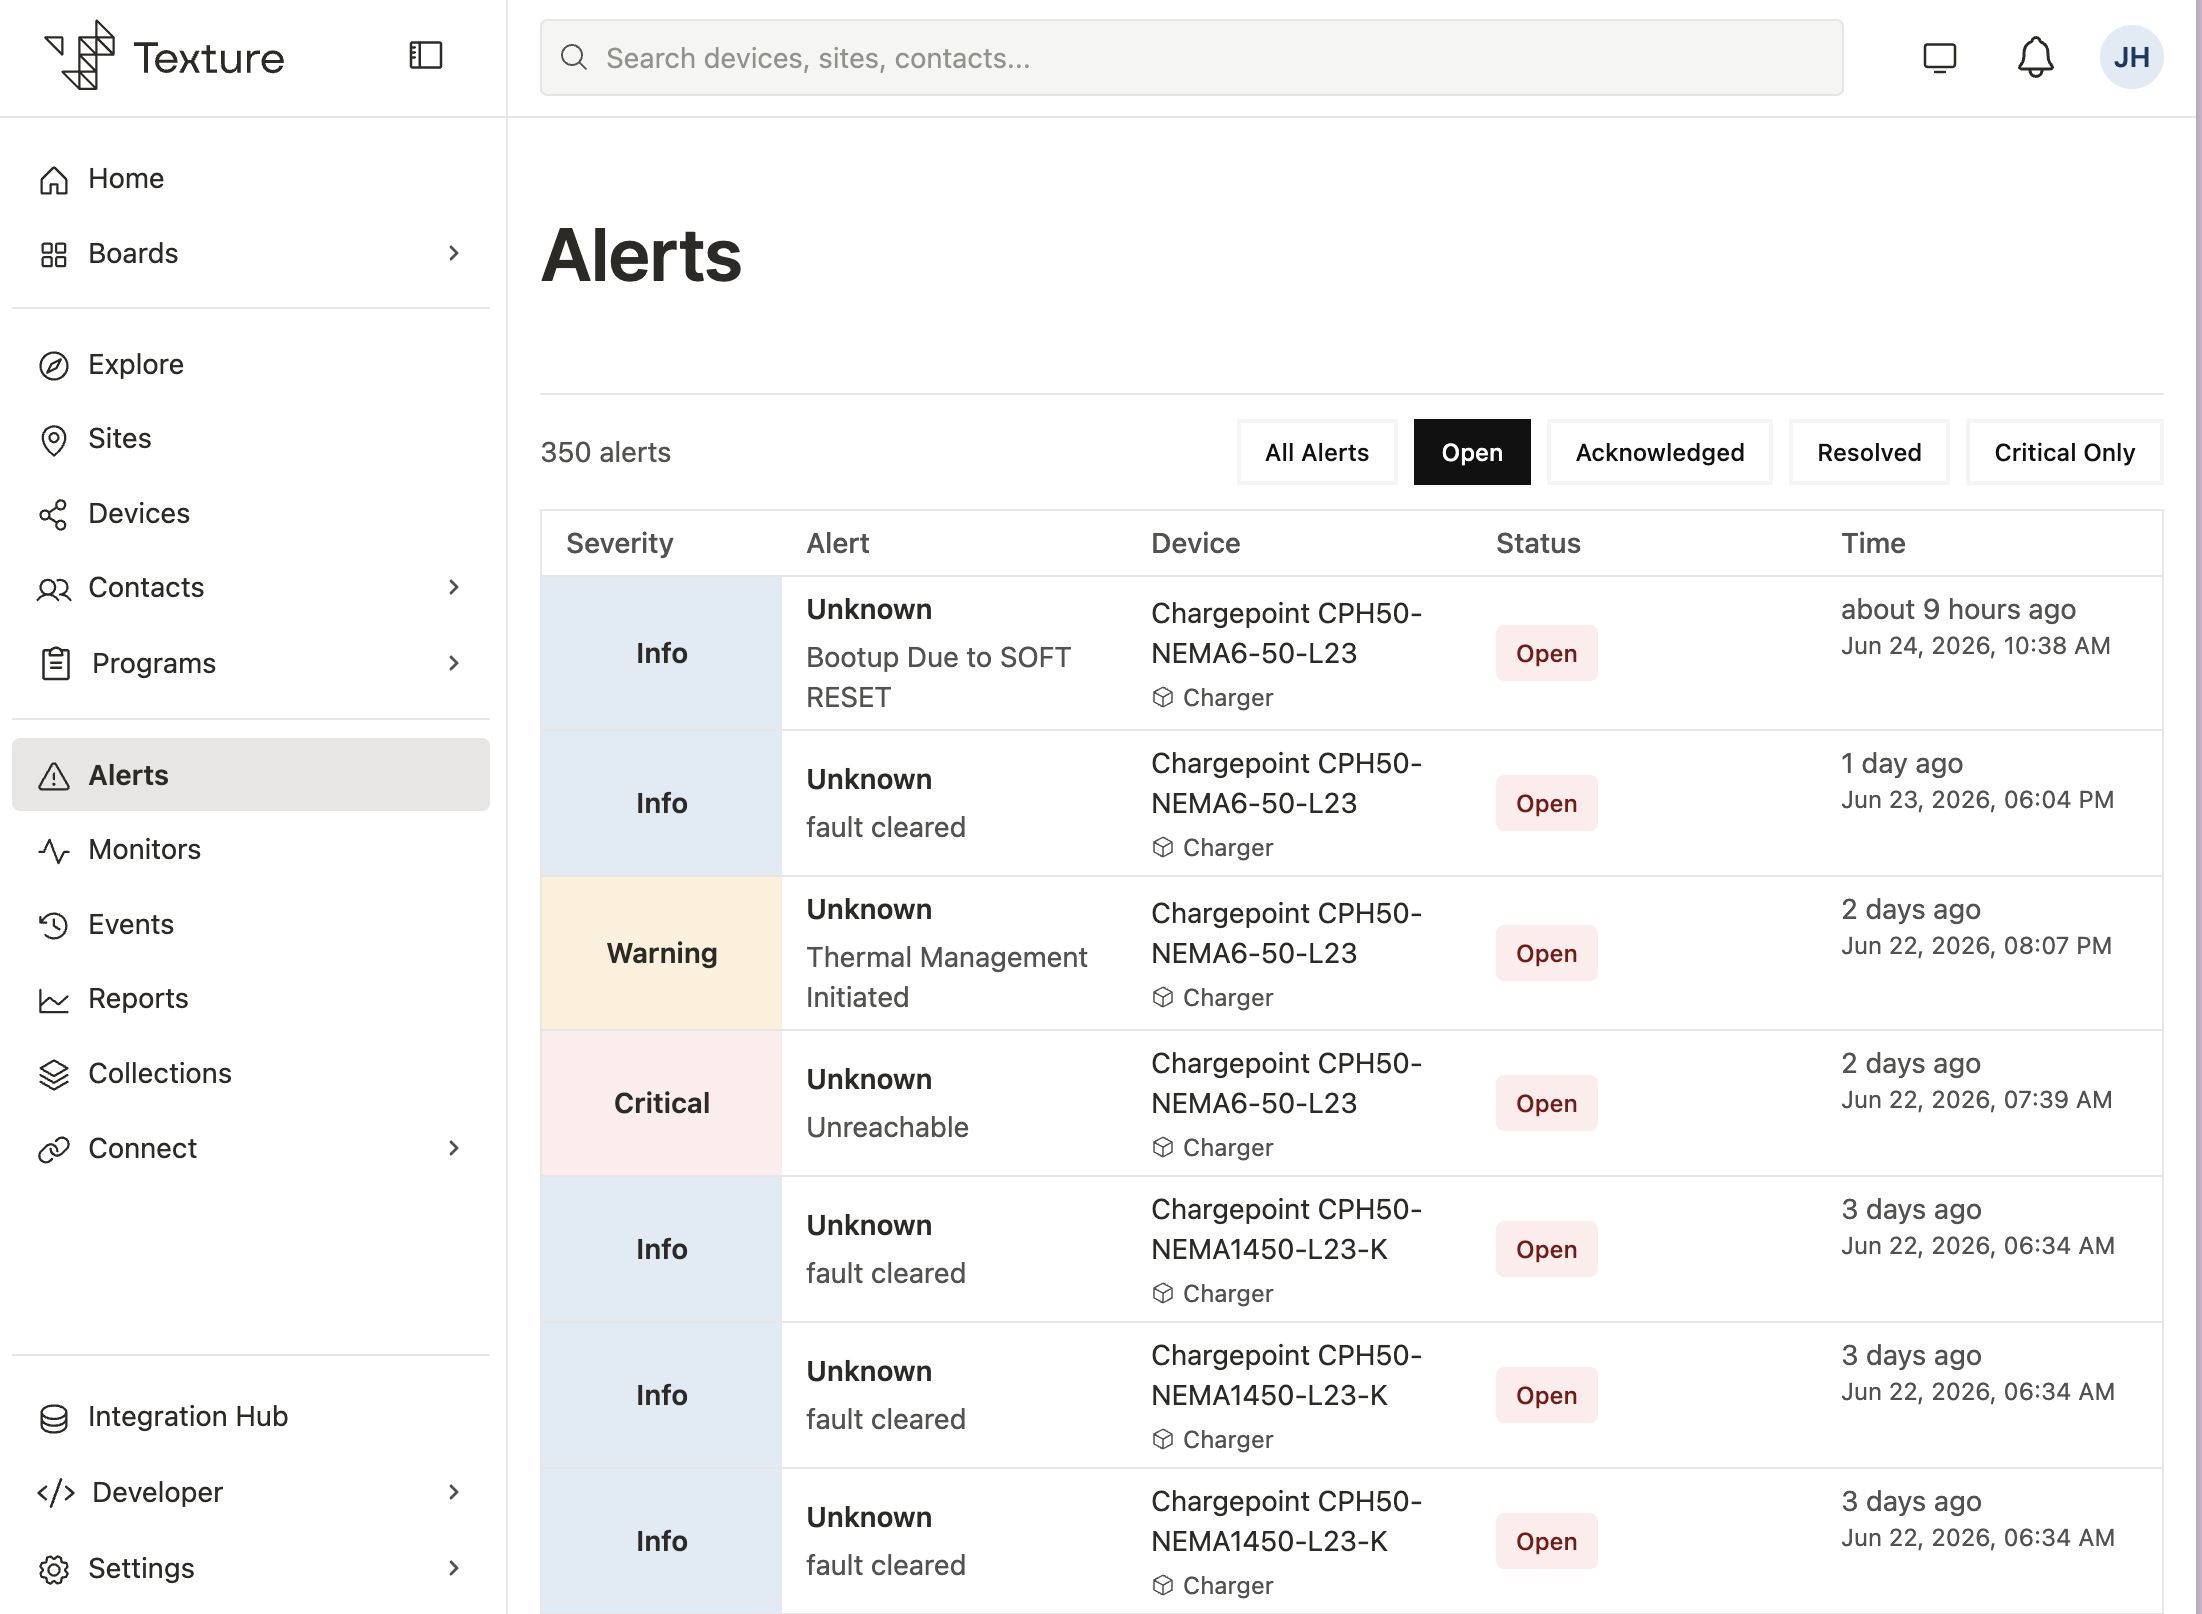
Alerts surface operational issues, notifications, and insights across the Texture platform. They consolidate signals from devices, sites, external services, and Texture automations so operators know what needs attention. Each alert records what happened, where it occurred, how severe it is, and what actions have been taken.
This page is the complete reference for alerts: the capture principle and data model, how alerts are classified, how to configure workspace visibility, and how alerts arrive from OEM integrations.
Why alerts matter#
- Situational awareness — Maintain a real-time pulse on device health, site performance, and platform automations.
- Coordinated response — Track acknowledgement, remediation, and resolution so teams never duplicate effort.
- Platform-wide connectivity — Link alerts to Sites and Devices for fast navigation between an incident, the underlying asset, and related context.
- Auditable history — Preserve a full record of status changes, snoozes, and resolutions for compliance and post-event analysis.
Capture principle#
Texture always captures incoming alerts, regardless of workspace visibility settings. When you hide alerts or narrow severity and OEM filters, the platform still stores every alert. Filtering applies only to what operators see in the Dashboard and what external systems receive through Destinations (for example, ALERT_CREATED webhooks). Nothing is deleted or dropped at ingestion.
This separation keeps a complete audit trail while letting each workspace control noise in the UI and notification pipeline.
Core data model#
Alerts follow a consistent schema across the API and Dashboard. Key fields include:
| Field | Description |
|---|---|
id / externalId | Unique identifiers for the alert in Texture and any upstream system. |
workspaceId, siteId, deviceId | Scope the alert to a workspace, site, and (optionally) a specific device. |
title, description | Human-readable summary and optional detail about the condition. |
type, subtype | Structured classification (see Classification). Prefer these over legacy alertType. |
alertType | Legacy free-text classification. Deprecated in favor of type / subtype. |
severity | Required level: CRITICAL, WARNING, or INFO. |
status | Operational state: OPEN, ACKNOWLEDGED, IGNORED, or RESOLVED. |
sourceSystem | Where the alert originated (Texture automation, OEM adapter, partner integration, manual entry). |
providerName, providerCode | Human-readable and coded identifiers for the upstream provider when applicable. |
acknowledgedAt / by, resolvedAt / by, ignoredAt / by, snoozedUntil | Response workflow and temporary suppression timestamps. |
createdAt, updatedAt | Lifecycle auditing timestamps. |
manufacturer, deviceName, deviceType, deviceModel, deviceSerialNumber | Device metadata enrichment when available. |
Alerts are linked to their workspace, site, and device, so you can navigate from an incident to the underlying assets in the Dashboard and API responses.
Classification#
Severity#
Severity communicates how urgently an alert must be handled:
| Value | Meaning |
|---|---|
CRITICAL | Immediate action required for safety or system availability. |
WARNING | Elevated attention needed to prevent impact or degraded performance. |
INFO | Informational events worth monitoring but typically not disruptive. |
Status lifecycle#
Operators drive an alert through these states:
- Open (
OPEN) — Newly created and awaiting action. - Acknowledged (
ACKNOWLEDGED) — Someone is actively working the issue. - Ignored (
IGNORED) — Intentionally suppressed without resolution (for example, a false positive). - Resolved (
RESOLVED) — Root cause addressed and the alert closed.
Snoozing sets snoozedUntil to pause follow-up for a defined window without changing the underlying status.
Types and subtypes#
Use type and (optionally) subtype to classify alerts for filtering, routing, and analytics. Ingestion pipelines map free-text OEM messages into these canonical values where possible.
Alert types#
| Type | Typical domain |
|---|---|
COMMUNICATIONS | Device, meter, or controller connectivity |
POWER_LIMIT | Site power limits, ramp rate, power factor |
GRID_STATUS | Grid forming, following, resync |
HARDWARE_FAULT | Inverter, battery, contactor, generator faults |
FIRMWARE_UPDATE | Firmware update status |
CONFIGURATION | Configuration or setup issues |
VOLTAGE_FREQUENCY | Voltage drop, frequency deviation |
STATE_OF_ENERGY | State of energy, reserve, power saving |
TEMPERATURE | Thermal and overtemperature events |
ISLANDING | Islanding / anti-islanding |
GENERATOR | Generator-related faults |
SOFTWARE_PROCESS | Control agent or process failures |
SENSOR | Sensor faults and disconnects |
SYSTEM_SHUTDOWN | External or GPIO shutdown |
PERFORMANCE_DEGRADED | Yield or performance below expectation |
SITE_LEVEL | Site-wide conditions |
SAFETY | Safety-related events |
UNKNOWN | Unclassified (no mapping rule matched) |
Alert subtypes#
| Subtype | Usually paired with |
|---|---|
BATTERY_METER_COMMS / INVERTER_COMMS / PV_INVERTER_COMMS / SITE_CONTROLLER_COMMS | COMMUNICATIONS |
SITE_MAX_LIMITED / SITE_MIN_LIMITED / RAMP_RATE_LIMITED / POWER_FACTOR_LIMITED | POWER_LIMIT |
GRID_FORMING / GRID_FOLLOWING / GRID_RESYNC_FAILED | GRID_STATUS |
INVERTER_FAULT / BATTERY_FAULT / CONTACTOR_FAULT / GENERATOR_FAULT | HARDWARE_FAULT |
OPTICASTER_EXE_FAILED / CONTROL_AGENT_CRASHED | SOFTWARE_PROCESS |
LOW_SOE / SLEEP_MODE / WAIT_FOR_SOLAR | STATE_OF_ENERGY |
EXTERNAL_SWITCH_SHUTDOWN / GPIO_SHUTDOWN | SYSTEM_SHUTDOWN |
EXCESSIVE_VOLTAGE_DROP / FREQUENCY_DEVIATION | VOLTAGE_FREQUENCY |
METER_DISCONNECTED / TEMPERATURE_SENSOR_FAULT | SENSOR |
PERFORMANCE_BELOW_EXPECTATION | PERFORMANCE_DEGRADED |
Creating and updating alerts#
Texture supports multiple creation paths, all sharing the same schema and lifecycle:
| Path | Description |
|---|---|
| REST API | Publish alerts from your own systems or automations, and update acknowledgement, ignore, or resolve states programmatically. |
| Dashboard | Operators can file alerts manually for field-discovered issues, using the same schema and lifecycle as API-created alerts. |
| External ingestion | Alerts flow in from OEM platforms and partner applications. Use externalId and provider fields for traceability (see OEM alert ingestion below). |
Configuring alert visibility#
Workspace alert configuration lets you reduce noise without losing data. Each workspace has its own settings for visibility, severity filters, and per-integration (OEM) overrides. Configuration affects what you see and what gets notified — never what Texture stores.
Where to configure#
- Open the Texture Dashboard.
- Go to Settings → Alerts (
/settings/alerts). - Adjust the controls below, then click Save to apply changes to the workspace.
Only workspace admins and owners can edit alert settings. Other members see the configuration in read-only mode.
Important — configuration is opt-in per workspace. Until you save at least once, the platform does not apply any visibility filters — all alerts remain visible and all fan out to Destinations — even though the form shows recommended defaults (
CRITICALandWARNINGon,INFOoff). Those defaults are enforced only after the first Save. This keeps existing workspaces backward-compatible.
Capture vs. visibility#
| Layer | Affected by config? |
|---|---|
| Ingestion and database storage | No — every alert is captured |
| Dashboard lists (alerts query, Site / Device alerts) | Yes — after first save |
Destination fanout (ALERT_CREATED, etc.) | Yes — after first save |
Hidden alerts remain available for audit, compliance, and internal operations. If the platform cannot read your saved configuration (for example, a transient database error), it fails open: alerts stay visible and notifications continue until the config can be read again.
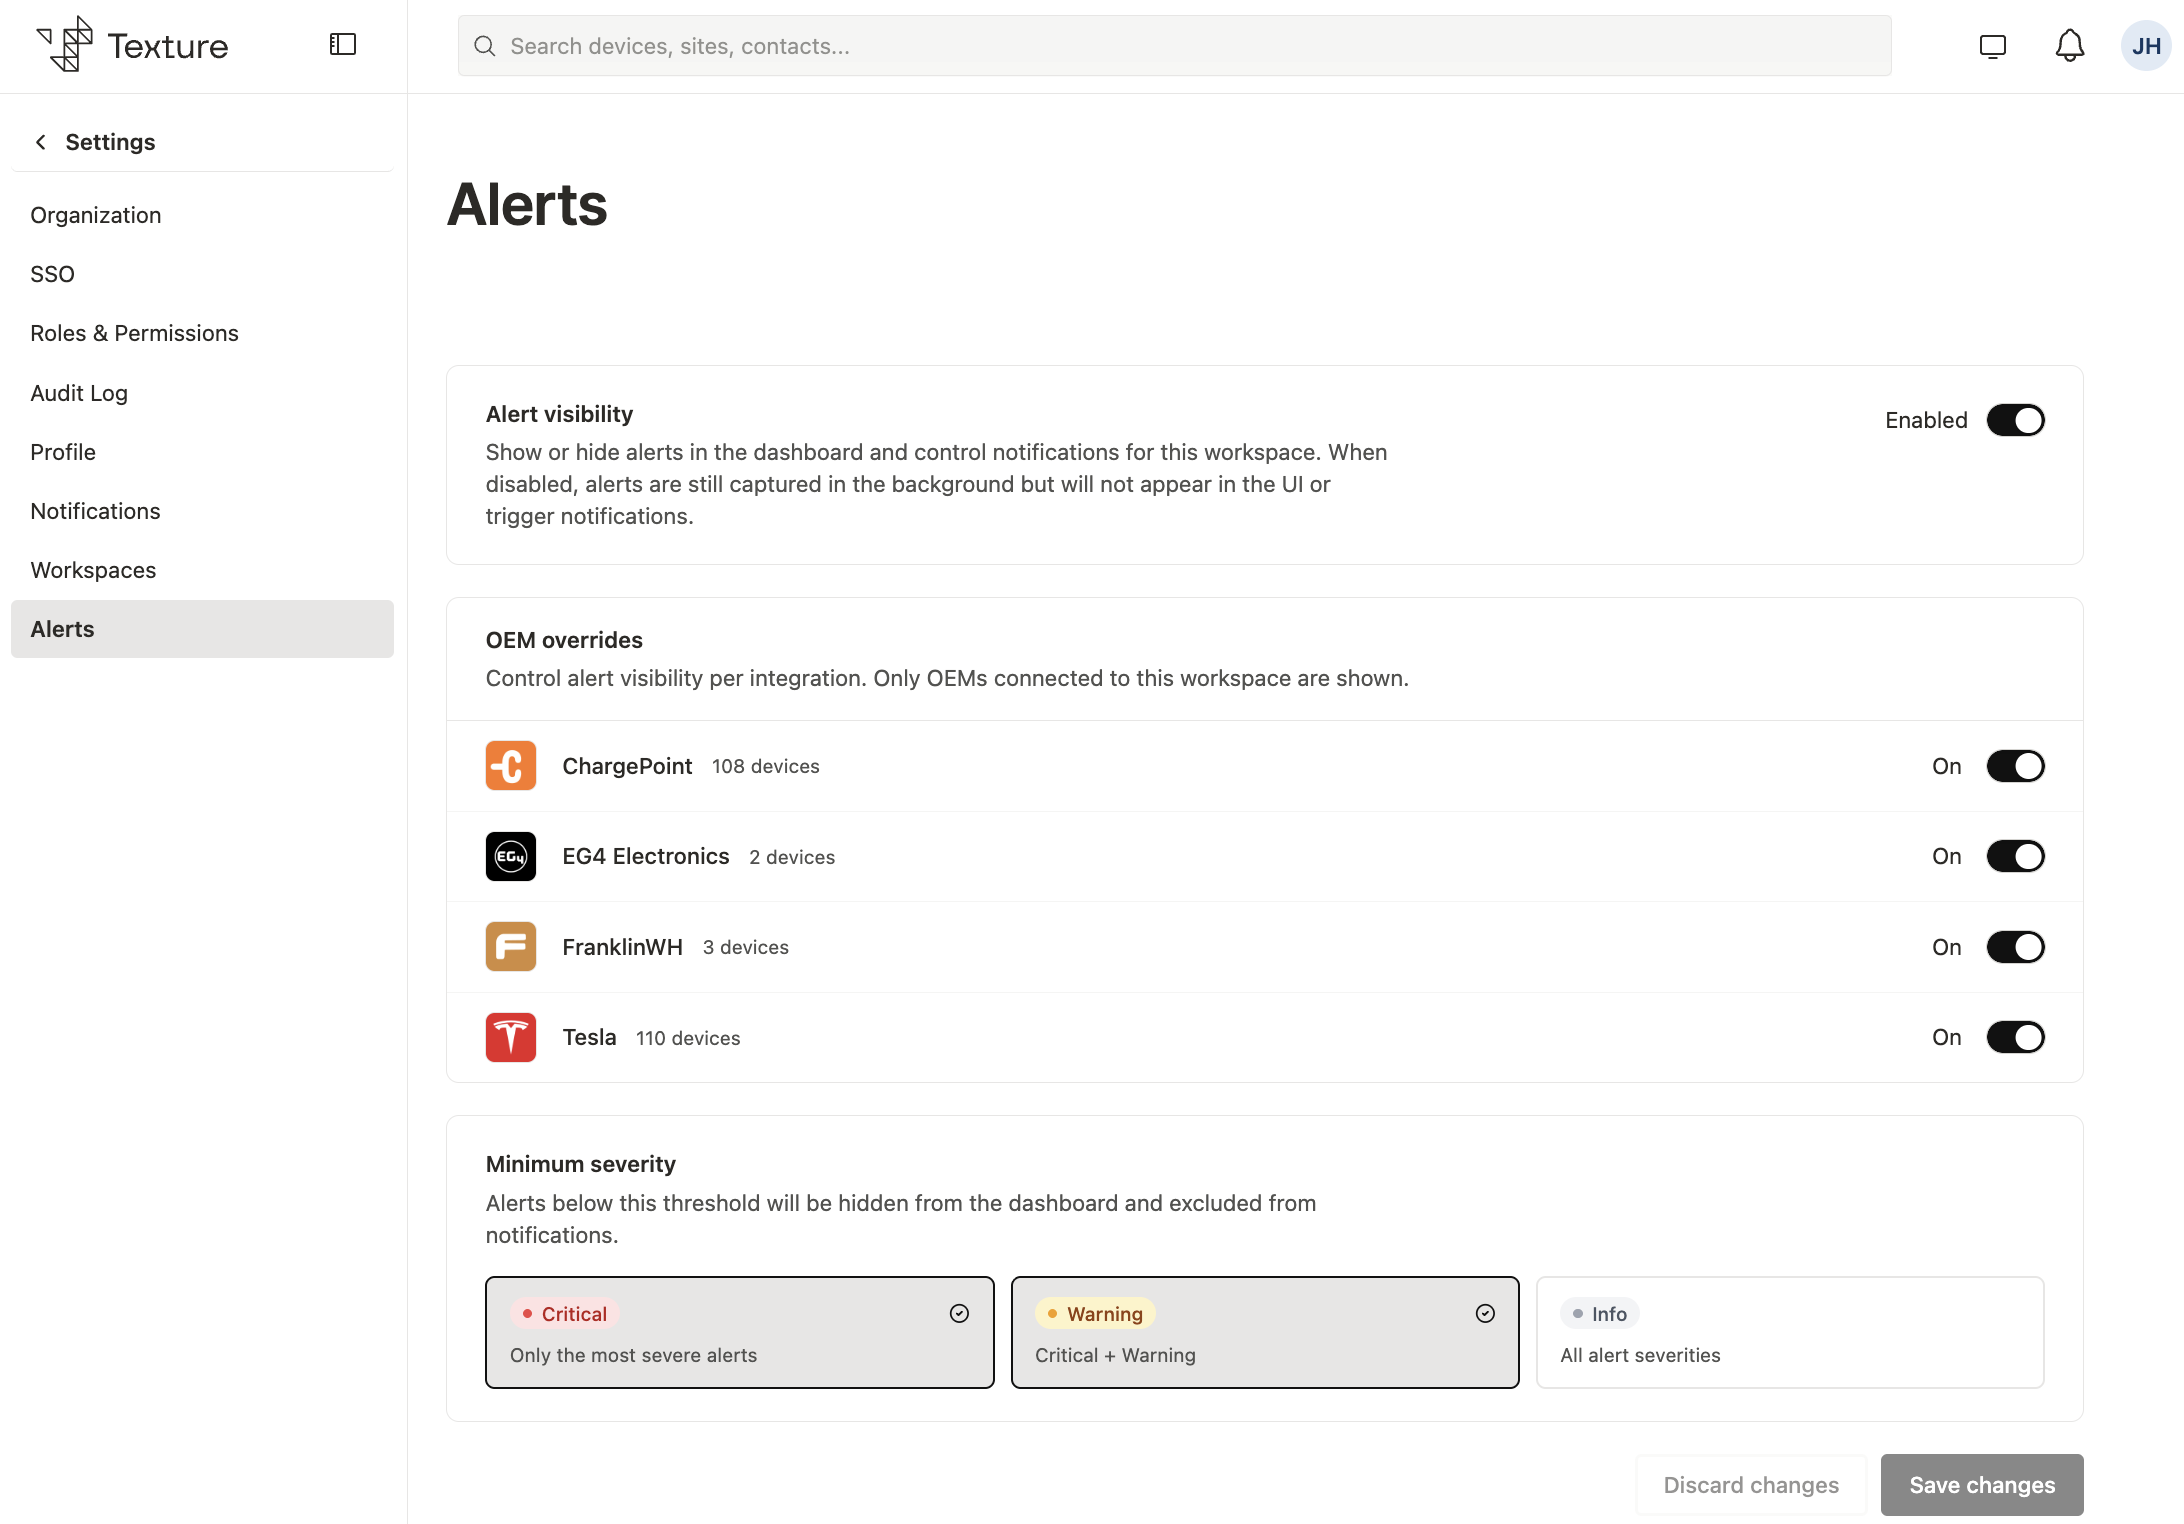
Controls#
Alert visibility (master switch). The workspace-level on/off switch. When disabled, no alerts are shown and no alert fanout occurs — but capture continues in the background. Severity and OEM sections dim when the switch is off, yet remain editable so you can prepare settings before re-enabling.
Severity filters. Each level (CRITICAL, WARNING, INFO) is an independent toggle; only alerts whose severity matches an enabled level are shown and notified. Disabling all three while visibility is enabled means nothing appears or notifies (alerts are still captured).
UI labels vs. behavior. The Dashboard may describe severity cards with phrases like "Critical + Warning." Backend filtering treats each level independently — you enable the specific severities you want, not a cumulative minimum threshold.
OEM overrides. Control visibility per connected integration (manufacturer). The section lists only OEMs with active connections. Turning an integration off hides its alerts from the Dashboard and excludes them from notification fanout. Overrides are keyed by manufacturer slug (for example, solaredge-web, enphase, sma) — the same identifier used at ingestion. Only off overrides are stored; you never need to turn integrations on explicitly.
Common scenarios#
- Reduce
INFOnoise — keep visibility enabled, enableCRITICALandWARNING, disableINFO, save.INFOalerts are still stored but hidden. - Pause all alert notifications — disable Alert visibility and save. Re-enable when ready; severity and OEM settings are preserved.
- Hide one noisy integration — keep visibility enabled, turn the OEM override off for that integration, save.
- Return to showing everything — save a permissive config (all severities on, no OEM overrides off, visibility enabled).
Settings apply to the current workspace only — switch workspaces to configure each separately. Workspace alert configuration is set in the Dashboard; there is no REST endpoint for it today.
OEM alert ingestion#
Alerts ingested from OEM and partner systems share the same Texture schema, but each integration differs in polling cadence, severity mapping, resolution behavior, and volume. Use this section when tuning configuration or investigating noisy fleets.
Provider key vs. connection slug#
Two identifiers appear in the Dashboard and documentation:
| Identifier | Where it appears | Used for |
|---|---|---|
| Connection manufacturer slug | Connect / Settings → Alerts OEM list (e.g. solaredge-web, enphase) | Dashboard labels; OEM override key in workspace settings |
Alert.provider | Stored on each alert row; event pipeline | Visibility filtering and OEM override enforcement |
When the keys differ, overrides may not apply. Usually the connection slug and stored
Alert.providermatch (for example,enphase/enphase). When they differ (notably SolarEdge: slugsolaredge-web, providersolaredge), an OEM override toggled in the Dashboard may not hide alerts until the override key matches the stored provider value. Filtering compares overrides againstAlert.provider, not the display fields.
Provider summary#
| Integration | Connection slug | Alert.provider | Primary ingestion path |
|---|---|---|---|
| SolarEdge Web Monitoring | solaredge-web | solaredge | Alert adapter (connection.poll) + OEM adapter |
| Enphase | enphase | enphase | Alert adapter (site alert polling) |
| SMA | sma | sma | Alert adapter (provider grant poll) + OEM adapter |
| Also Energy | also-energy | also-energy | Alert adapter (app / provider grant poll) |
| ChargePoint | chargepoint | chargepoint | OEM adapter |
| Generac | generac | generac | OEM adapter |
| Tesla (grid services) | tesla / program-specific | tesla | OEM adapter (grid services alerts) |
Manual and programmatically created alerts use other provider values (for example manual, or values you supply when creating an alert).
Provider severity & status mapping#
- SolarEdge — severity derived from numeric impact (high →
CRITICAL, moderate →WARNING, zero/low →INFO); status prefersserverStatus, else infers from open / muted flags. Quirks: highINFOvolume, cross-poll deduplication, rich HTML descriptions, some types auto-clear after sustained normal operation, and the OAuth v2 endpoint lacks date-range / pagination. - Enphase — codes 1–2 →
CRITICAL, 3 →WARNING, 4–6 →INFO; status isOPENuntilalarm_end_timeis set, thenRESOLVED. Severity may arrive as number or string (normalized); unknown codes may fall back toINFO. - SMA — Error / Disturbance →
CRITICAL, Warning →WARNING, Info →INFO; Appeared (or missing) →OPEN, Solved →RESOLVED. Quirks: duplicate status pings (deduplicated, but bursts after reconnects) and rapid Appeared / Solved cycles. - Also Energy — severity / status derived from alert code, title, and hardware state; codes mapped to type / subtype where known. Hardware-centric; grant-scoped polling; can be feature-gated per manufacturer during maintenance.
- ChargePoint / Generac / Tesla — publish via the OEM adapter with stable provider keys matching their slug in most cases (Tesla grid-services connection slug may differ from provider).
Reducing alert volume#
| Goal | Suggested approach |
|---|---|
| Cut informational noise | Disable INFO in severity filters after first save |
| Silence one integration | OEM override off for that slug if it matches Alert.provider; otherwise filter by severity |
| Pause all outbound noise | Disable Alert visibility (master switch); capture continues |
| Audit full history | Query or export outside filtered Dashboard views; all alerts remain stored |
Working with alerts across the platform#
- Sites and devices — Each alert references its originating site and, when applicable, a device. Site and device views expose associated alerts for impact and history.
- Search and filtering — Filter by
type,subtype,severity,status, site, and device. Workspace visibility settings further narrow the Dashboard after configuration is saved. - Destinations — Alert lifecycle events can flow to webhooks, email, SMS, and Kafka. Visibility settings gate fanout.
Next steps#
- Configure workspace visibility under Settings → Alerts to tune severity and OEM filters.
- Connect Sites and Devices to see how alerts relate to core platform resources.
- Set up Destinations to deliver
ALERT_CREATEDand related events to external systems.